Lewis & Clark National Historic Trail Visitor Use and Economic Expenditure Patterns
A 2024 study of visitor use patterns and economic impact across five sites along the Lewis & Clark National Historic Trail

What this study found
The Lewis & Clark National Historic Trail (LECL) generated $14.5 million in annual visitor expenditures across five surveyed sites, supporting 195 jobs in the Midwest and $7.49 million in labor income.
- 62% of visitors were first-time visitors
- 14% described their visit as part of a longer LECL trip — averaging 10 sites
- 73% planned their trip in advance, most using the NPS website
- Repeat visitors made an average of 3 trips to their survey site in the prior 12 months
The study combined on-site visitor surveys, aggregated mobility data (MDD), and IMPLAN economic modeling. Six sites were selected; the figures above exclude Gateway Arch National Park.
Site-by-site impacts

Lewis & Clark National Historic Trail Headquarters Visitor Center
Explore in 360°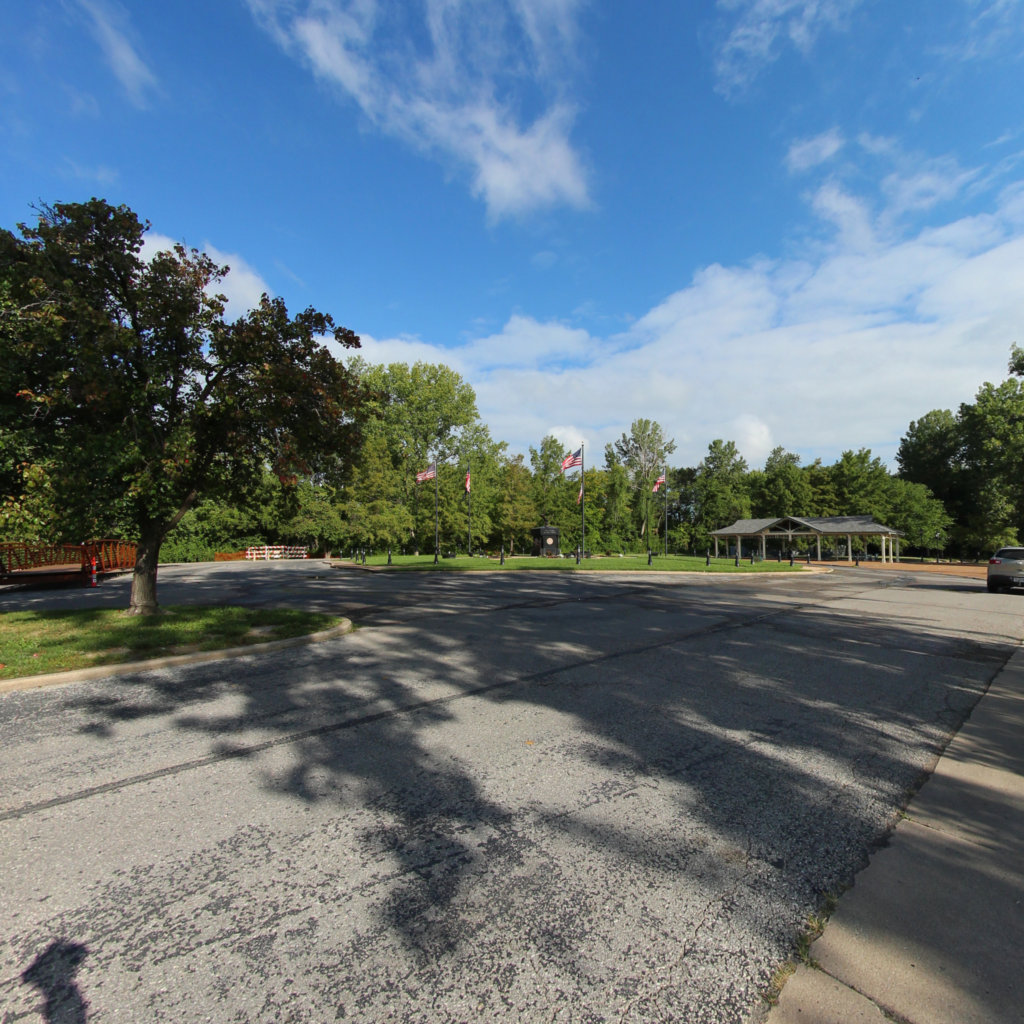
Lewis & Clark Boat House and Museum
Explore in 360°
Lewis & Clark State Park
Explore in 360°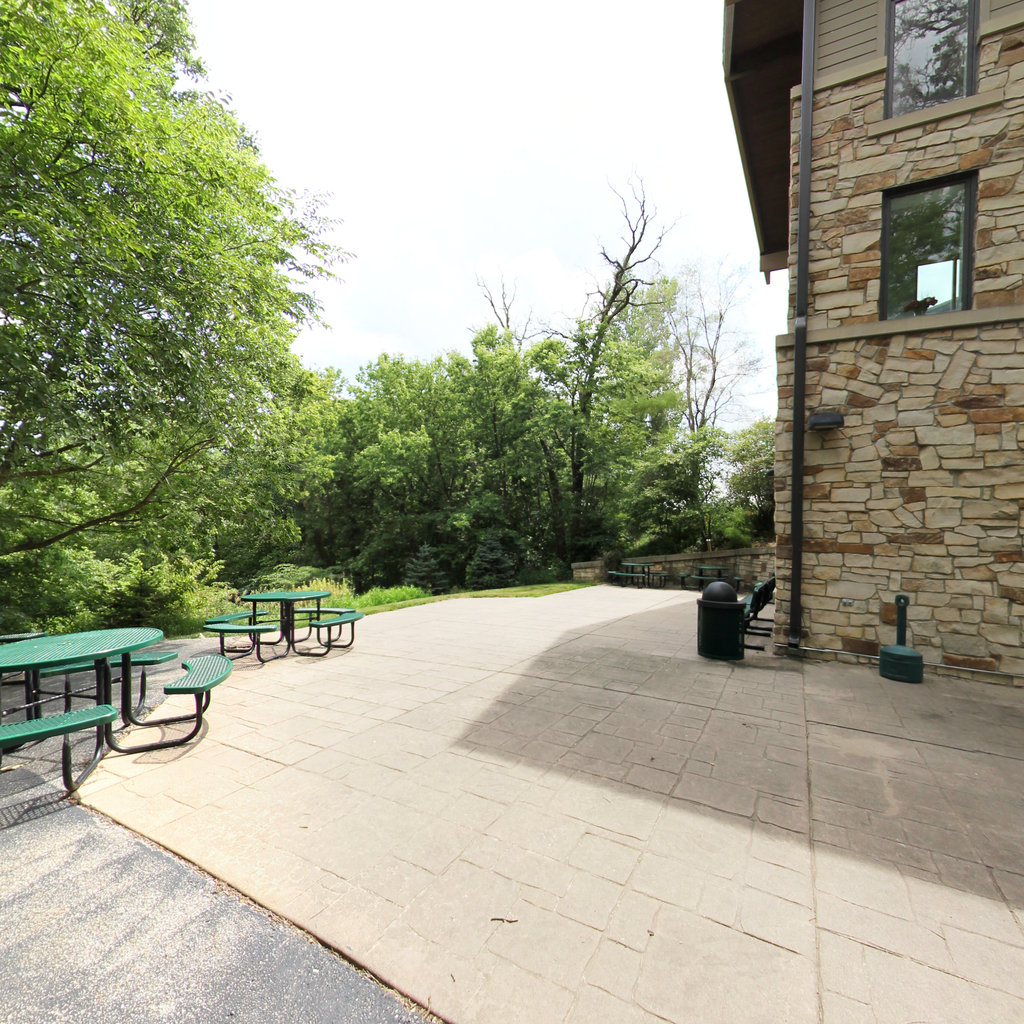
Missouri River Basin Interpretive Center
Explore in 360°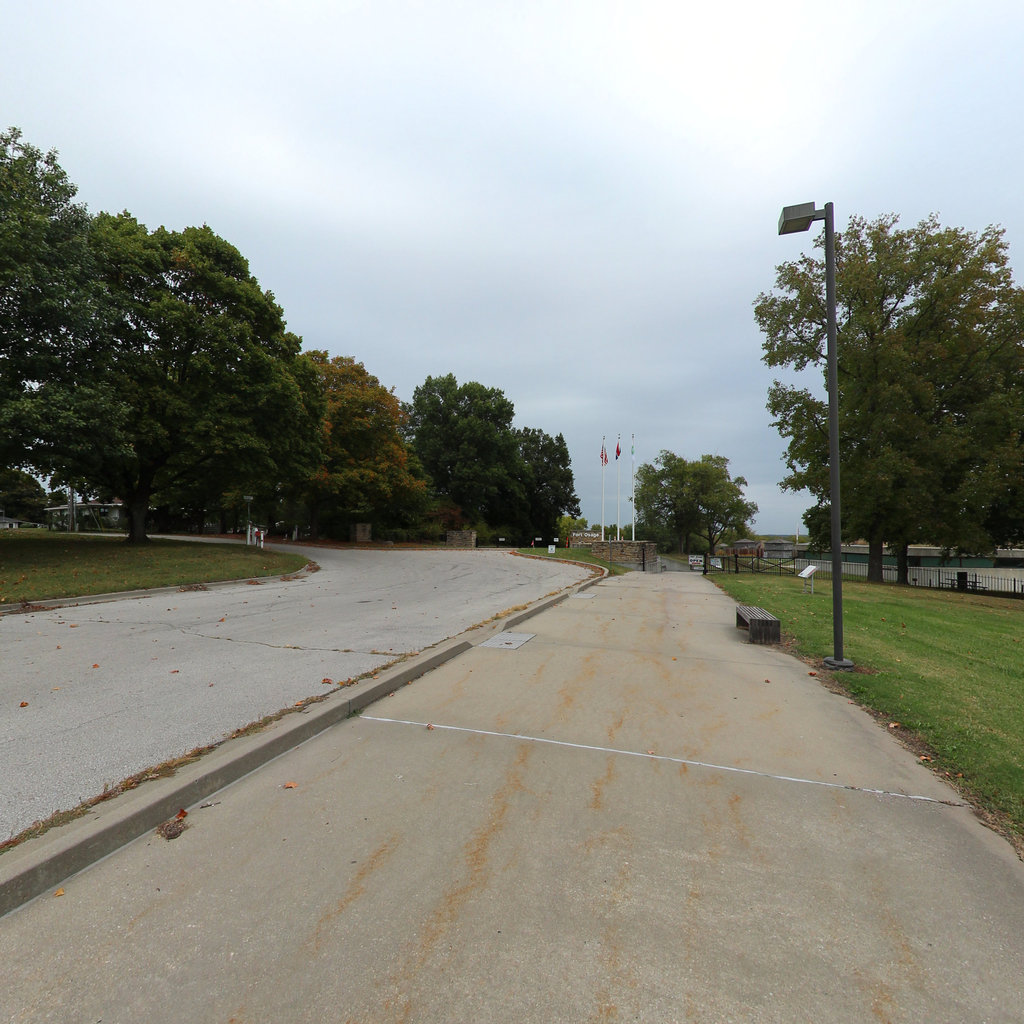
Fort Osage National Historic Landmark
Explore in 360°Sites compared
One site — Lewis & Clark State Park — carries most of the corridor’s economic weight. The same ranking holds across every dimension the study measured.
Visitor profile
Where visitors came from
The Trail draws visitors from across the country — not just the Midwest. The biggest cluster is the corridor itself (Missouri + Nebraska + Iowa + Illinois), but every region of the continental U.S. is represented.
Top 15 states by share of respondents
… plus 29 more states and Washington, D.C. at lower percentages.
International visitors
Methodology in brief
The study combined three methods: on-site intercept surveys at six selected sites along the trail, aggregated mobility data (MDD) for site-level visitation, and IMPLAN economic modeling to derive direct, indirect, and induced impacts.
The economic-impact totals reported here apply the IMPLAN Type SAM multiplier (1.8435) and Type I multiplier (1.4339) to expenditure data scaled from intercept surveys against 2023 visitation estimates. Gateway Arch National Park was excluded from the $14.5M aggregate.
Full report
Download Full Report (PDF)Recommended citation
Sharp, R. L., Maples, J. N., Bogucki, T., & Hicks, R. (2024). Lewis & Clark National Historic Trail visitor use and economic expenditure patterns. National Park Service & Lewis and Clark Trust, Inc.
Sharp, Maples, Bogucki & Hicks (2024). Lewis & Clark National Historic Trail Visitor Use and Economic Expenditure Patterns. Commissioned by the National Park Service (Lewis & Clark National Historic Trail) and the Lewis and Clark Trust, Inc.
The study data are open to the public for use without cost. The Lewis and Clark Trust respectfully requests credit for the Lewis & Clark National Historic Trail and the Lewis and Clark Trust in any publication or use, print or digital.
Authors & sponsors
Funded by: National Park Service · Lewis and Clark Trust, Inc.